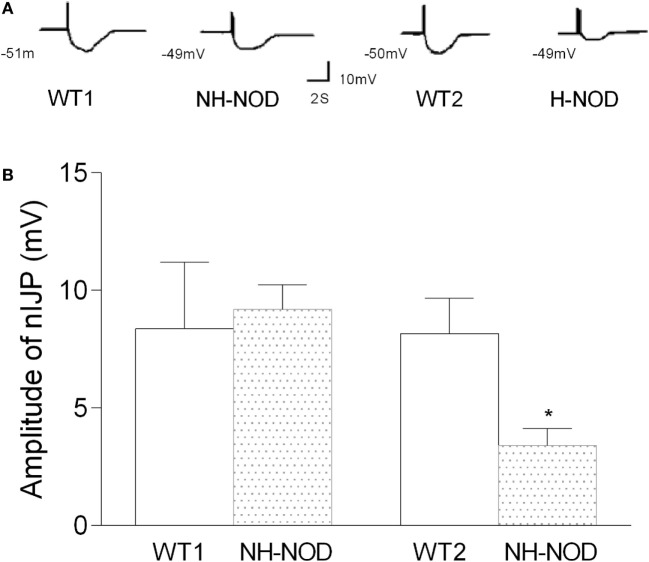
Figure 4.
Nitrergic IJP (nIJP) in wild-type (WT) controls, non-hyperglycemic NOD (NH-NOD), and hyperglycemic NOD. Panel (A) shows actual examples and panel (B) shows cumulative data on the amplitudes of the nIJP. Note that in NH-NOD the nIJP was reduced to 40% of WT controls. Values are mean ± SD. *P < 0.0001.

