FIGURE 2.

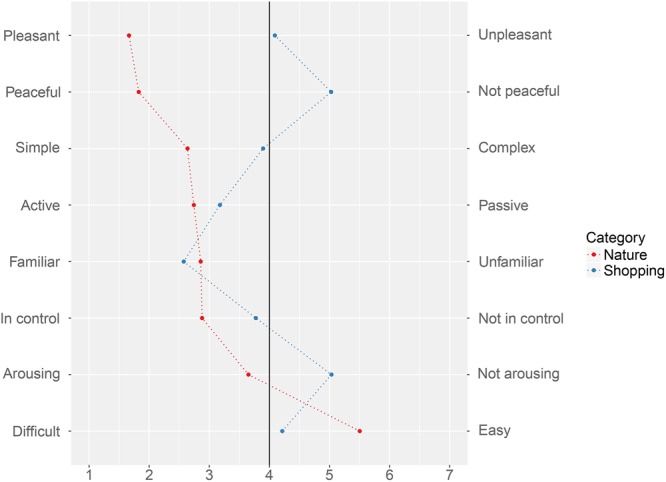
Semantic differential profile for the two experience categories. Points represent mean scores (used for illustrative purposes – see text for median), and dotted lines are included for each category to improve legibility.

Semantic differential profile for the two experience categories. Points represent mean scores (used for illustrative purposes – see text for median), and dotted lines are included for each category to improve legibility.