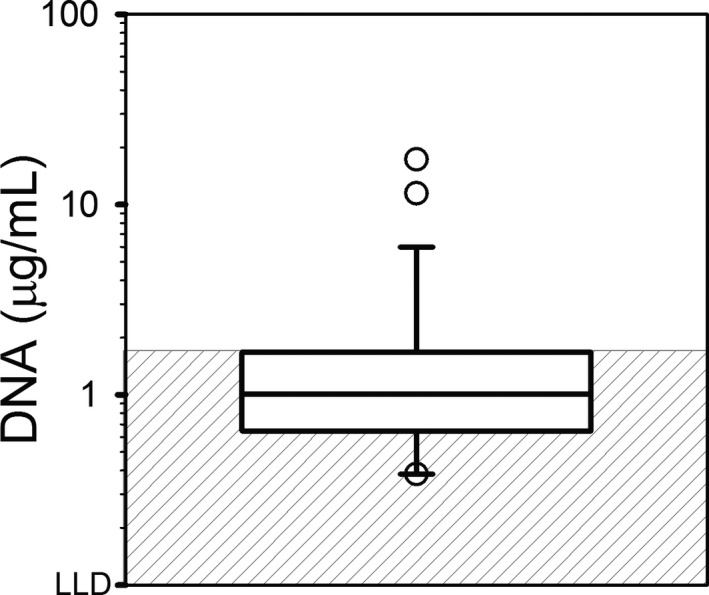
Figure 1.

Cell‐free DNA in Plasma from Dogs with IMHA (n = 26). Note that results could not be obtained with 9 samples due to pigmentemia. Due to the wide distribution of results, for visualization purposes, the data are plotted on a log scale, but the data were not log‐transformed for analysis. The line of centrality denotes median, the box indicates 25th to 75th percentile, and the whiskers indicate 10th to 90th percentile. The gray‐striped box represents the established reference interval of <1.5 μg/mL. LLD, lower limit of detection.
