Figure 4.

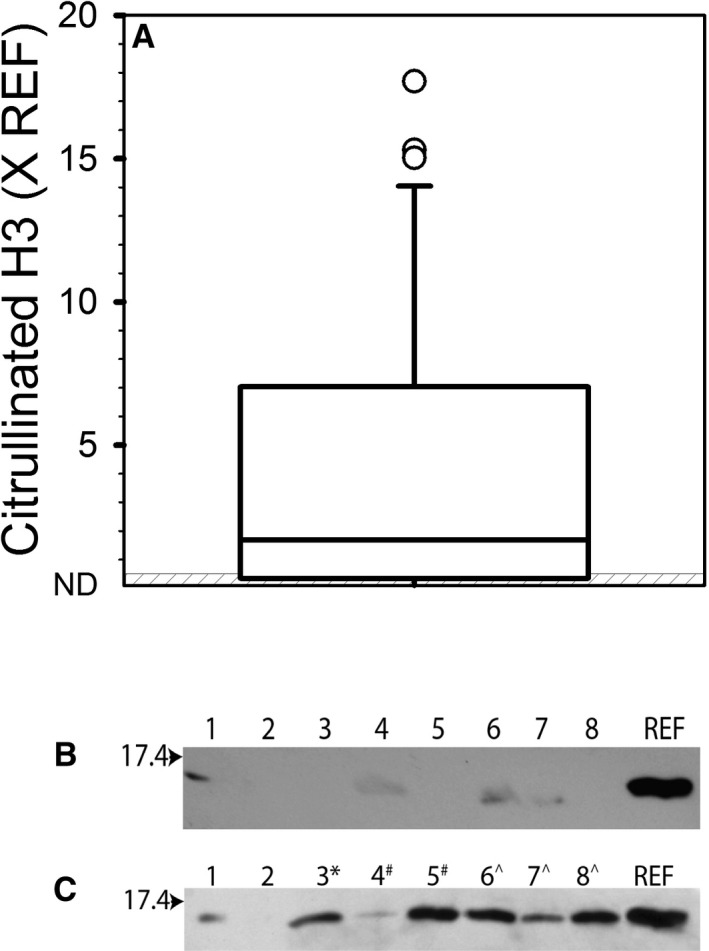
Citrullinated Histone H3 in Plasma. Plasma samples were evaluated for the presence of citrullinated histone H3 via Western blot as described in the Methods section, and quantified with respect to an internal reference sample. (A) Distribution of results obtained for plasma from dogs with IMHA (n = 32). The line of centrality denotes median, the box indicates 25th to 75th percentile, and the whiskers indicate 10th to 90th percentile. The gray‐striped box represents the reference interval of <0.48 × REF based on 95% confidence interval using samples from 26 apparently healthy dogs. (B) Example of Western blot image with samples from apparently healthy dogs. (C) Example of Western blot image with samples from dogs with IMHA. For B and C, the arrow denotes the location of the 17.4 KDa protein ladder band. Numbers at the top refer to the lane numbers. REF, the band lane containing the purified histone reference sample. Most plasma samples were diluted 4‐fold before loading, except for those denoted with *(8‐fold), #(16‐fold), and ^(32‐fold).
