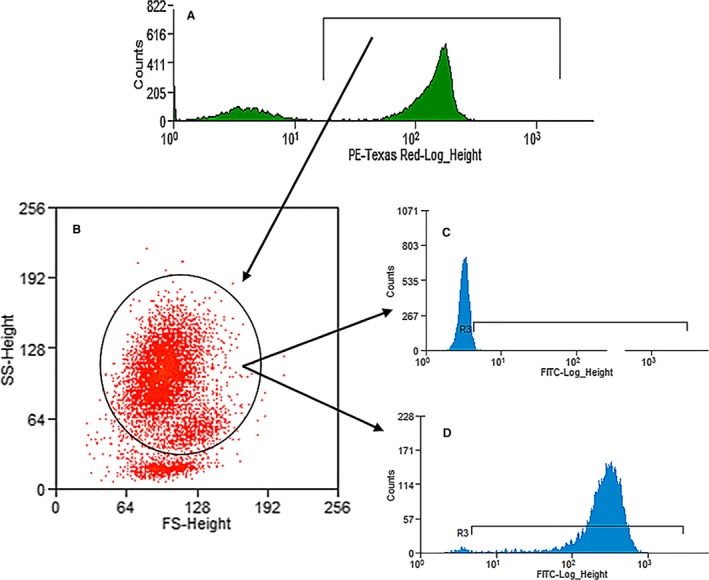
Figure 1.

Example of the gating scheme for phagocytosis and respiratory burst function. First, live cells were separated from artifact (A), then applied to a forward scatter versus side scatter plot (B). Phagocytic cells (neutrophils and monocytes combined) were identified and applied to a FITC histogram resulting in identification of negative (C) and positive (D) cells.
