
Figure 7.
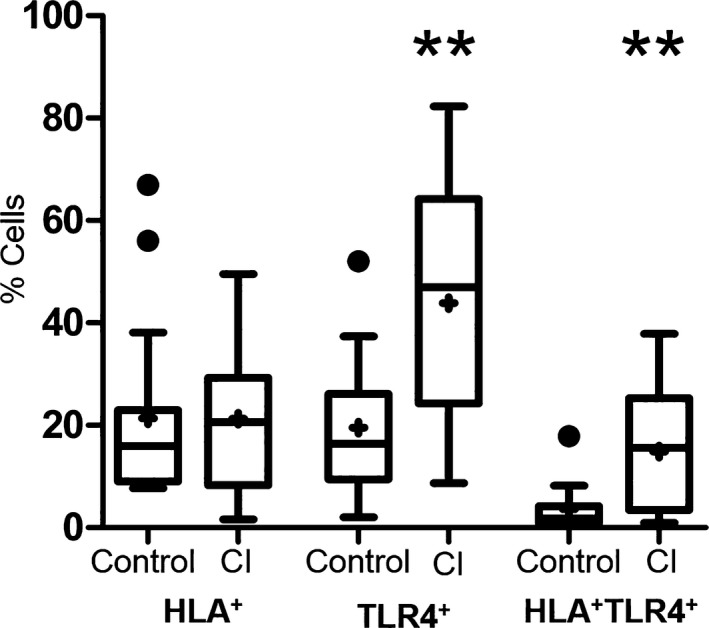
Percentage of cells expressing HLA‐DR and TLR‐4 surface markers on monocytes in healthy control versus critically ill (CI) dogs. There was no significant difference in monocytes expressing HLA‐DR (P = 0.743); however, there was a significant increase in the number of monocytes expressing TLR‐4 as well as co‐expression of HLA and TLR‐4 in the CI dogs. Data are presented as the median (horizontal line) and mean (+), with the 25th and 75th quartiles in each box plot. The whiskers indicate the highest and lowest data points within 1.5× the length of the quartiles. The circles represent outliers. Mann–Whitney ranked sum test; (**) indicates 0.01>P > 0.001.