
Figure 1.
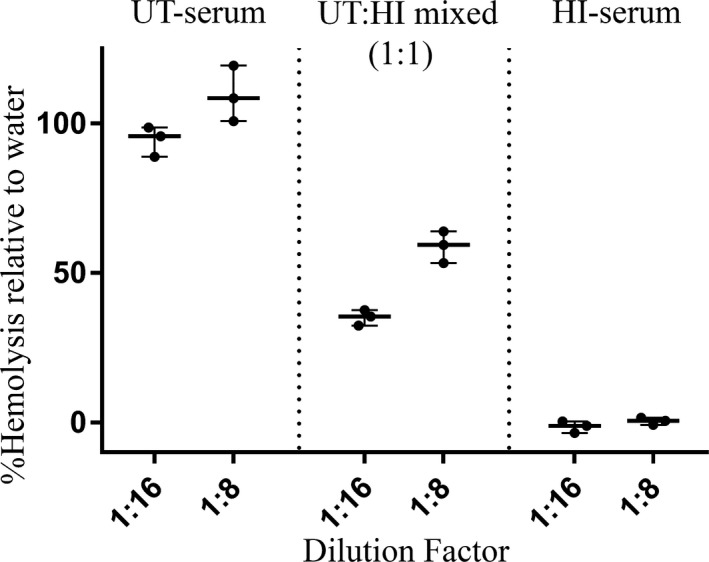
Whisker plot representing the hemolytic activity of untreated (UT) and heat‐inactivated (HI) canine complement serum on antibody‐coated sheep erythrocytes (Ab‐SRBCs). The hemolytic activity of 1 : 1 mixture of UT and HI canine complement serum is also shown. Lines represent the median, and dots are individual experimental replicates. Hemolysis was measured by quantifying the release of hemoglobin using spectrophotometry (OD540). Percentages (%) of hemolysis of canine complement serum compared to lysis in distilled water (ordinate) are plotted against the serum dilution factor (abscissa).