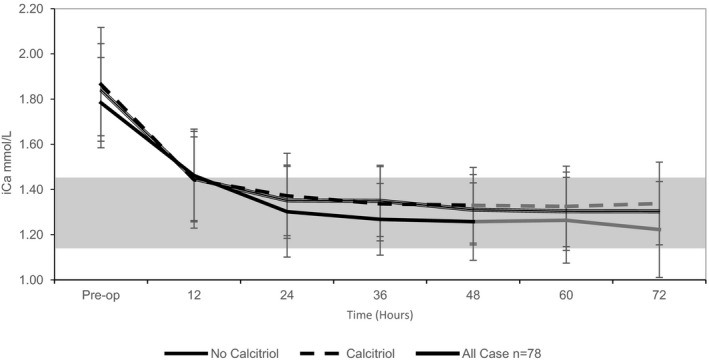
Figure 1.

Graph plot of the mean iCa (mmol/L) over time for treatment groups (no calcitriol administration; calcitriol administration) with standard deviation bars. iCa trends between the treatment groups are similar and illustrate the association of pre‐op iCa to post‐op iCa in the immediate post‐op period. Both study groups become normocalcemic within 24 hours and then plateau through 72 hours. The first 48 hours includes the entire study group (black, n = 78), while 23 cases were lost from 48 hours through 72 hours (gray, n = 55). Normal iCa reference ranges (gray shaded).
