Fig. 1.

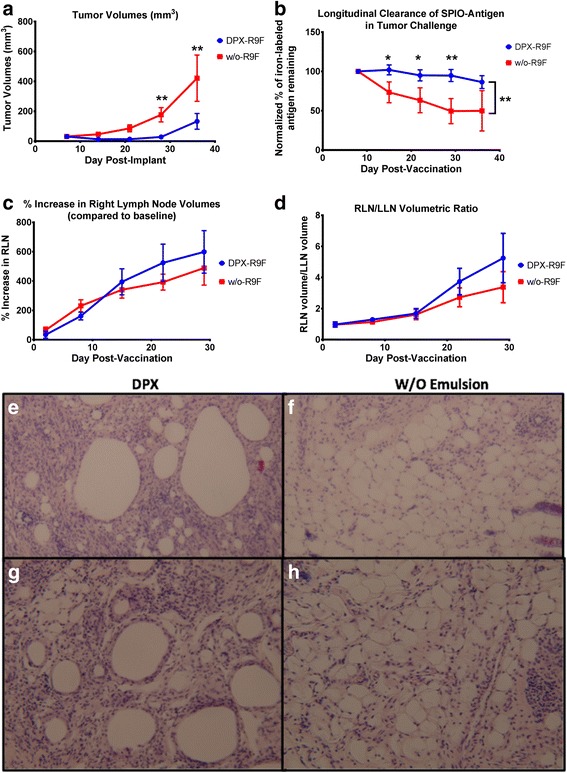
Graphs demonstrating volumetric changes in inguinal lymph nodes and tumours over the course of the study comparing DPX-R9F(n = 23) and w/o-R9F (n = 29) and Histological Evaluation of Site of Injection for DPX-R9F and w/o-R9F. a Tumour volume time course (mm3). b) Normalized % amount of SPIO-R9F remaining at the SOI. c % Right lymph node (RLN) volume increase over time (draining vaccine site). d Ratio of RLN volume over LLN volume. Data on graphs is mean ± SE. Significance was calculated using a 2-way ANOVA to compare overall differences across groups and time, and Holm-Sidak corrected t-tests to compare individual time points, * = p < 0.1, ** = p < 0.05. SOIs were extracted from 5 mice per group 14 days after immunization, sectioned and stained by H&E. Representative figures for 2 different mice are shown for DPX-R9F (e, g) and w/o-R9F (f, h)
