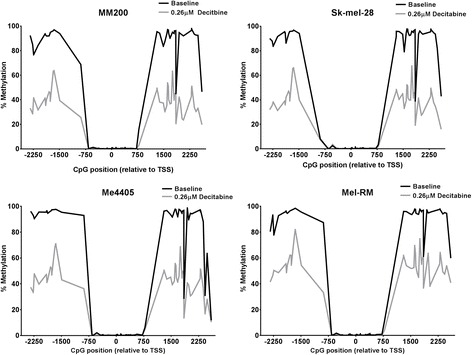
Fig. 2.

DNA methylation pattern of the XPC CpG island before and after decitabine. Methylation levels in each melanoma cell line at baseline (black) and after treatment with 0.26 μM decitabine (grey) was quantified by bisulfite sequencing. CpG position is shown relative to XPC transcription start site (TSS). Upstream (5′) shore = position − 2341 to − 423, CpG island = position − 364 to 568, Downstream (3′) shore = position 714 to 2596
