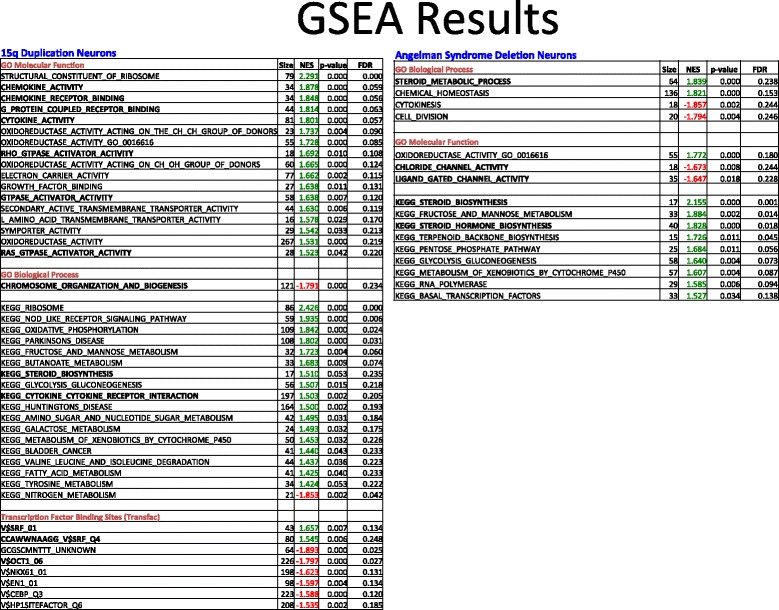
Fig. 4.

Summary of GSEA results at FDR q-value ≤ 0.25. The left side of table shows elevated chemokine/cytokine activity as well as both Rho and Ras G-coupled protein receptor activity. Also of note, a trending increase in transcripts responsible for steroid hormone biosynthesis and a decrease in transcripts involved in chromosomal organization. There is also a noted decrease in transcripts with OCT1 binding sites and a general increase in transcripts that respond to serum response factor (SRF). In the case of AS DPSC neuronal cultures, there was a noted increase in steroid metabolic processes and biosynthesis of steroid hormones (right table), but a general decrease in genes classified as having ligand gated and chloride channel activity. A complete list of all GSEA analysis is available in Additional file 1: Tables S1–S9
