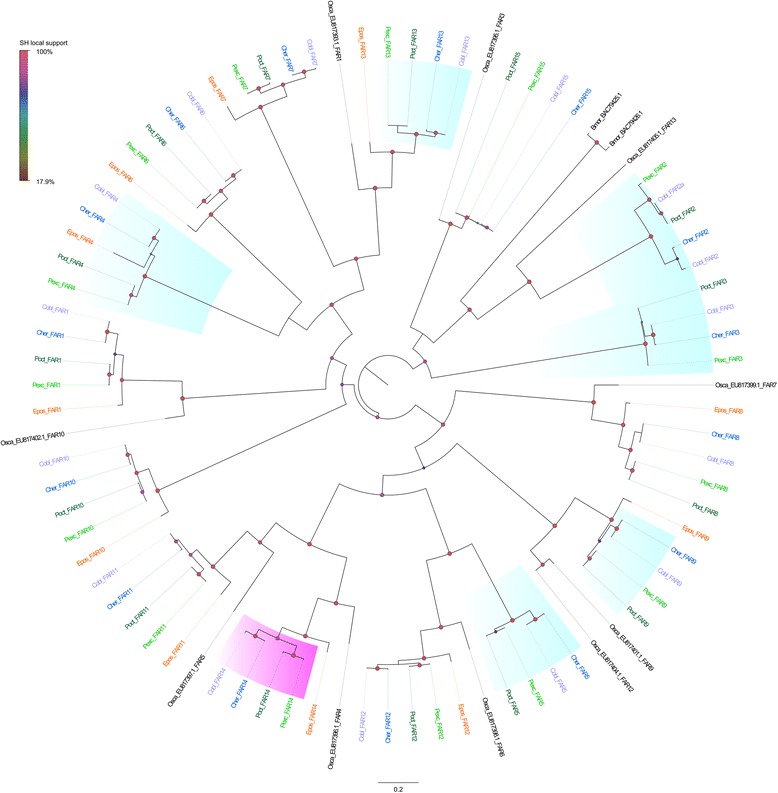
Fig. 6.

Maximum likelihood tree showing the evolutionary relationships among fatty acid reductase (FAR) proteins mined from the transcriptomes of the New Zealand leafroller moths Ctenopseustis herana (Cher, highlighted in blue), C. obliquana (Cobl, highlighted in light purple), Planotortrix excessana (Pexc, highlighted in light green) and P. octo (Poct, highlighted in dark green) and the horticultural pest Epiphyas postvittana (Epos, highlighted in orange) and including Bombyx mori (Bmor) and Ostrinia scapulalis (Osca). Circle at the nodes represent the Shimodaira-Hasegawa local support. Colours and size of circles are proportional to the percentage of support (0–100%). The clusters shaded in aquamarine highlight biased expression in pheromone glands relative to antennae and clusters shaded in fuchsia indicate biased expression in female antennae relative to pheromone glands
