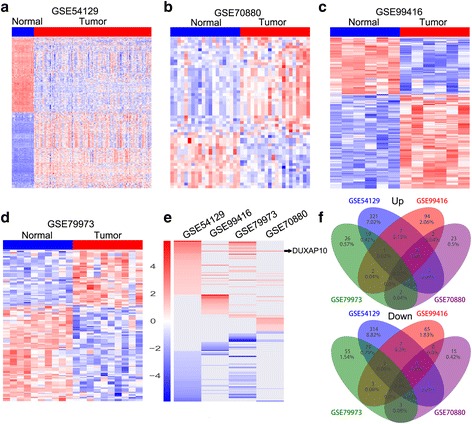
Fig. 1.

Identification of pseudogenes profiles in human gastric cancer. a-d The heatmaps were drawn to show the differentially expressed pseudogenes profiles in human gastric cancer and normal tissues using microarray data GSE54129, GSE70880, GSE79973, and GSE99416 from GEO. e A heatmap was drawn to show the differentially expressed pseudogenes (consistently altered at least two datasets, fold change) in GSE54129, GSE70880, GSE79973, and GSE99416 datasets. f Venn diagram of altered pseudogenes profiling in GSE54129, GSE70880, GSE79973, and GSE99416 datasets
