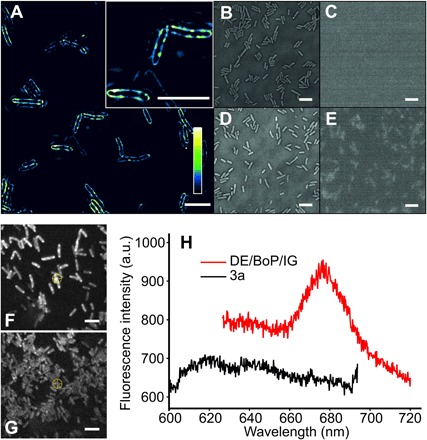
Fig. 4. SIM and fluorescence emission spectroscopy on the cellular distribution of Chl a in E. coli.

(A) SIM of the ALA-fed E. coli DE/BoP/IG cells. The color bar shows the color map of the image. The inset image shows the cellular distribution of Chl a in more detail. Scale bars, 5 μm. E. coli 3a cells with or without ALA feeding showed zero or limited fluorescence. (B to E) Bright-field and epifluorescence images of the E. coli 3a cells without (B and C) and with ALA feeding (D and E). Scale bars, 5 μm. (F and G) Fluorescence images of the ALA-fed E. coli (F) DE/BoP/IG and (G) 3a cells immobilized on an agar gel pad. Scale bars, 5 μm. (H) Fluorescence emission spectra recorded from individual E. coli DE/BoP/IG cells [marked with a front sight symbol in (G)]. a.u., arbitrary units.
