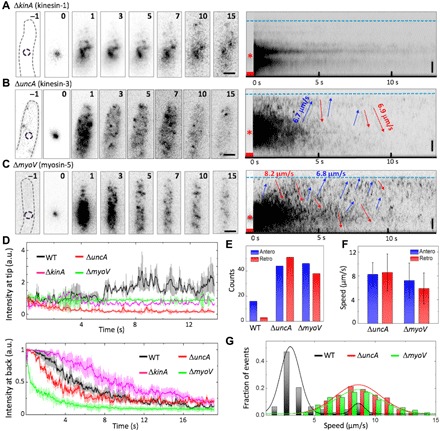
Fig. 3. Pulse-chase analysis of mEosFPthermo-ChsB in the hyphal tip regions of cells from motor mutants.

(A to C) Left: Image sequence upon photoconversion at t = 0 s for 1 s in a spot ~5 μm behind the hyphal tip (dashed circles in panels “–1”) of (A) ΔkinA, (B) ΔuncA, and (C) ΔmyoV. The elapsed time is given in seconds. Scale bars, 2 μm. Right: Corresponding kymographs; arrows indicate anterograde (blue) and retrograde (red) transport. Blue dashed lines and asterisks mark the positions of hyphal tips and photoconversion loci, respectively; red squares indicate the photoconversion intervals. Vertical scale bars, 2 μm. (D) Fluorescence intensities at (top) hyphal tips and (bottom) photoconversion loci from wild-type (WT) (black), ΔkinA (green), ΔuncA (red), and myoV (green) cells, averaged and plotted as mean ± SD (n = 3 to 5). (E) Number of anterograde (blue) and retrograde (red) transport events in six kymographs of WT, ΔuncA, and ΔmyoV. (F) Speed of anterograde (blue) and retrograde (red) transport in ΔuncA and ΔmyoV (mean ± SD). (G) Distribution of speeds in anterograde transport from WT (black), ΔuncA (red), and ΔmyoV (green) samples. a.u., arbitrary units.
