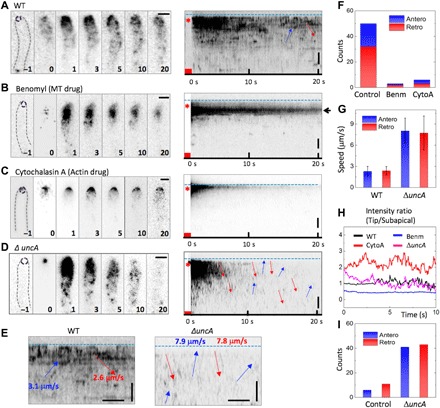
Fig. 4. Pulse-chase analysis after mEosFPthermo-ChsB photoconversion at the hyphal tip.

(A to D) Left: Image sequences upon photoconversion at t = 0 s for 1 s at the hyphal tips (dashed circles in panels “–1”) of (A) a WT cell without drugs (as a control) and in the presence of (B) benomyl (Benm), (C) cytochalasin A (CytoA), and (D) a cell from the ΔuncA strain. The elapsed time is given in seconds. Right: Corresponding kymographs; blue dashed lines and asterisks mark the positions of hyphal tips and photoconversion loci, respectively; red squares indicate the photoconversion intervals. (E) Enlarged kymographs of WT (left) and ΔuncA (right) cells; vertical scale bar, 2 μm; horizontal scale bar, 1 s. Arrows show anterograde (blue) and retrograde (red) transport events; blue dashed lines indicate the hyphal tip positions. (F) Number of anterograde (blue) or retrograde (red) transport events in 20 kymographs of the control, with benomyl, and with cytochalasin A. (G) Speeds of anterograde (blue) and retrograde (red) transport in WT and ΔuncA (mean ± SD). (H) Time courses of signal intensity ratio between hyphal tip area and subapical area from a WT cell without drugs (control) and in the presence of benomyl or cytochalasin A, and in the ΔuncA strain. Further details are given in fig. S3. (I) Number of anterograde (blue) or retrograde (red) transport events from five kymographs of WT and ΔuncA cells. MT, microtubule.
