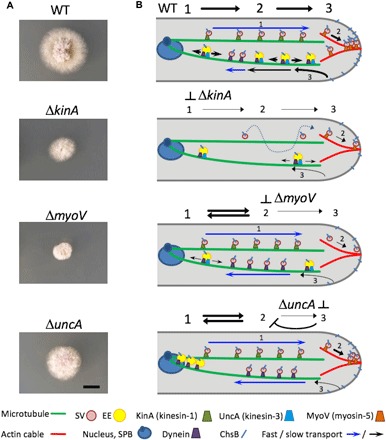
Fig. 5. Images of fungal colonies and schematic depictions of ChsB transport in WT, ΔkinA, ΔmyoV, and ΔuncA strains.

(A) Images of the colonies; scale bar (for all images), 5 mm. Strains were grown on the same minimal medium glucose agar plate for 2 days. (B) Depictions of ChsB transport processes in the four strains (for details, see the text); the symbol legend is included below. SPB, spindle pole body.
