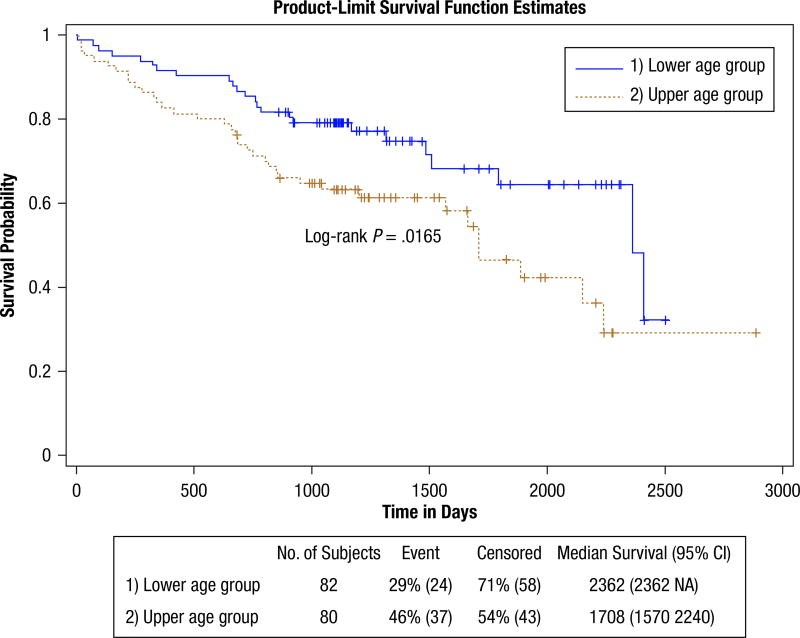
Figure 1.
Age Survival. This Shows the Survival Probability Curves for the Full (full group) Data Set. The Lower Age Group (upper blue curve) and Upper Age Group (lower brown curve) Were Formed by Using the Median Age as the Cut Point. The Lower Age Group Has a Survival Advantage (hazard ratio, 1.86)

