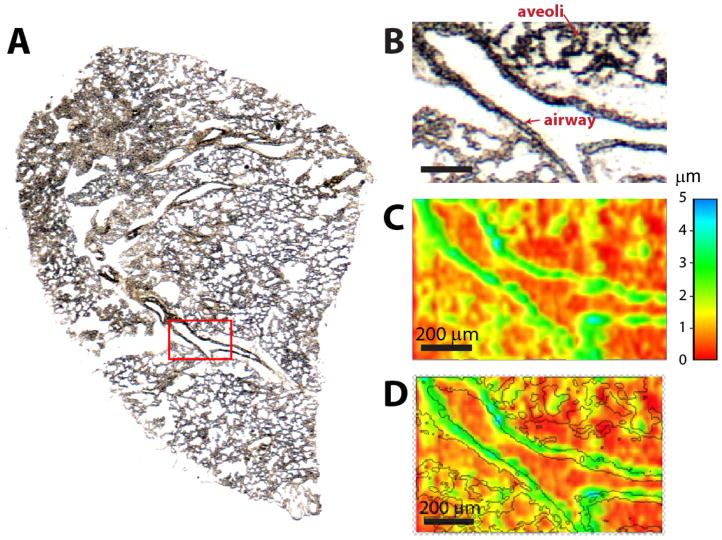
Figure 1.
(A) Optical image of the lung tissue section highlighting a small, 1 × 0.5 mm, region examined in this study. (B) Optical and (C) topography images of the region of the lung tissue selected for high-resolution nano-DESI MSI. (D) Overlay of the optical and topography images demonstrating overlap of the elevated parts of the tissue section with the airway.

