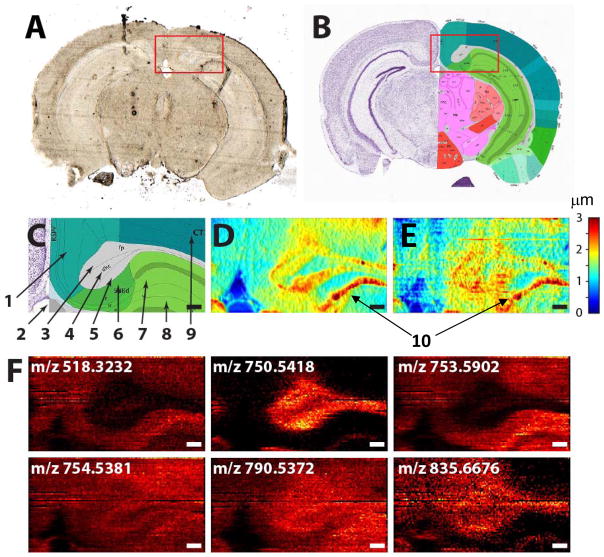
Figure 3.
(A) Optical image of a coronal mouse brain tissue section and (B) a corresponding coronal section (#81) from the mouse brain atlas (http://atlas.brain-map.org); C) zoomed-in region corresponding to the red box in panel B with the following regions labeled: 1- retrosplenial cortex, 2-ventricle, 3-corpus callosum, 4-dorsal hippocampal commisure, 5- alveus, 6-subiculum, 7- hippocampal region CA1, 8-dentate gyrus, and 9-visual areas of isocortex. This area was analyzed using D) contact profilometry and E) topography image obtained using shear force microscopy. 10- a scratch observed in topography images. Color bar shows height in microns. F) Selected ion images obtained using nano-DESI MSI coupled to shear force microscopy. Scale bar is 200 μm.

