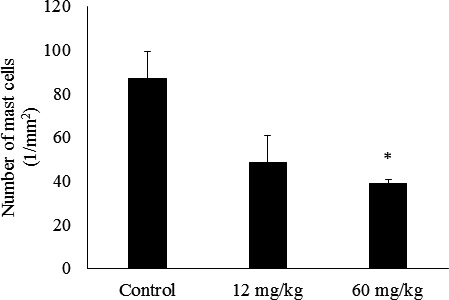
Fig. 6.

Effect of CAPS administration on mast cells in the dermis of NC mice (n=4).
The results are expressed as mean ± standard error (n=4). The differences between the control and the CAPS administration groups were statistically significant by the Steel test (p<0.05).
