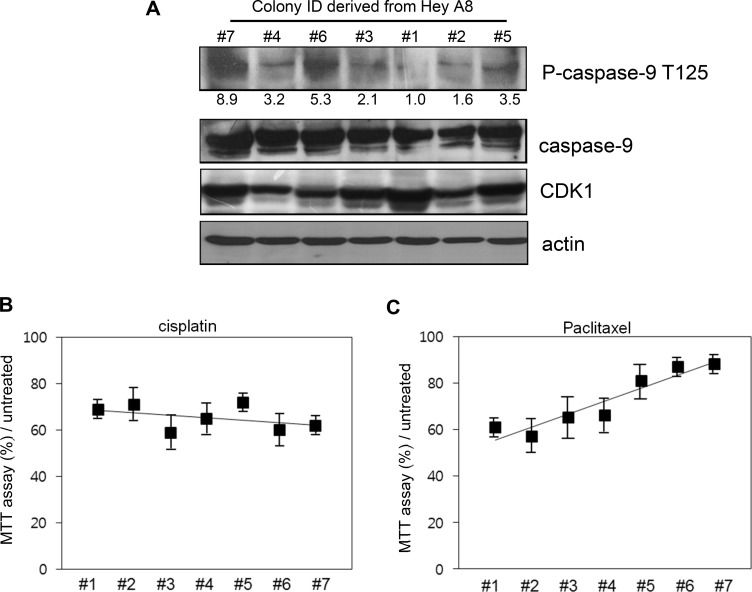
Figure 3. Correlation between caspase-9 phosphorylation level and resistance to cell death.
(A) The colonies with different phosphorylation level were selected after low-dose paclitaxel treatment and cultured for 7 additional days. The ID number was conferred based on the phosphorylation level detected with western blot analysis. Relative density of phospho-caspase-9 was analyzed by Image J 3.0. (B) Different cells were treated with cisplatin for 12 h and cell viability assessed using MTT assay. (C) Cells were treated with paclitaxel and cell death assessed using MTT assay.

