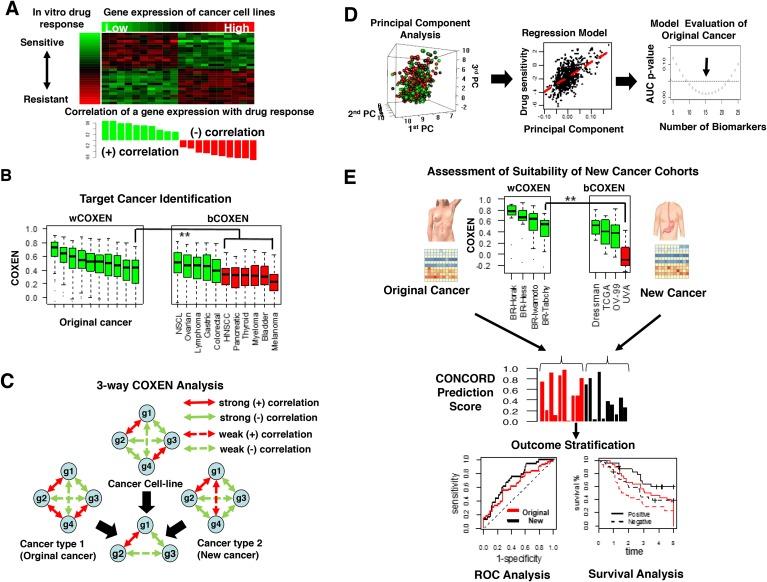
Figure 1. Overview of CONCORD drug response prediction.
(A) A heatmap of gene expression subset of NCI-60 cancer cell line panel and in vitro drug response profile, log GI-50, attached on the left side (top) and a bar graph showed positive (green) or negative correlation (red) between each gene expression and log GI-50 (bottom). (B) wCOXEN (left) and bCOXEN distributions (right): green boxes on bCOXEN indicate new cancer types suitable for cross-cancer type prediction from an original cancer. (C) A conceptual example of 3-way COXEN analysis: 4 genes resulted in 3 concordantly co-expressed genes across cell line and two human cancer subtypes. Solid and dotted line arrows indicate strong and weak correlation coefficients between connected genes, and red and green colored arrows represent positive and negative correlations, respectively. (D) Principal components of gene expression of drug sensitivity genes (left), multiple linear regression of GI-50 values on the principal components (middle), selecting a final predictor though testing performances of multiple candidate models (right). (E) Assessment of suitability of cohorts in new cancer types for cross-cancer prediction and validation (top), distribution of CONCORD prediction scores in original cancer (red) and new cancer cohort (black) (middle), comparisons of ROC or survival curves for external validation of cross-cancer type prediction (bottom).

