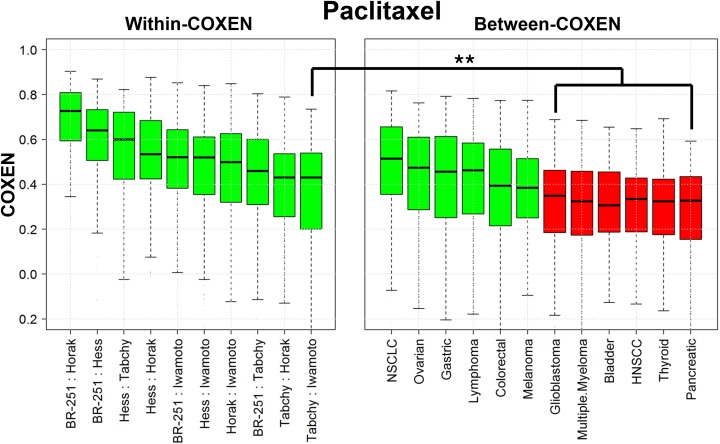
Figure 2. wCOXEN and bCOXEN of paclitaxel chemo-sensitivity biomarkers.
Distribution of COXENs within breast cancer (wCOXEN; left panel) and that of COXEN between breast cancer and each of other cancer types (bCOXEN; right panel). bCOXEN boxplots were sorted by Wilcoxon rank sum test p-values. Green bCOXEN boxplots represent cancer types relevant to cross-cancer prediction by having statistically insignificant difference from the lowest wCOXEN (** Bonferroni-adjusted Wilcoxon rank sum test p-value < 0.025).

