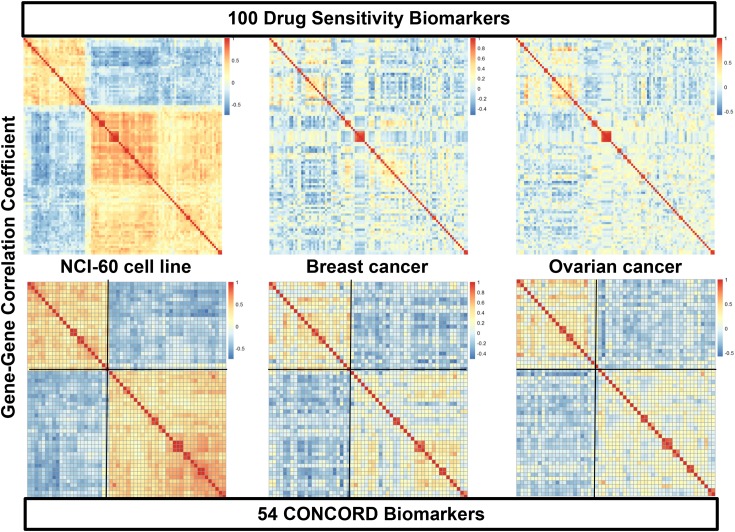
Figure 3. Heatmaps of gene-gene correlation matrices of initial drug sensitivity biomarkers and CONCORD biomarkers.
The top three clustering heatmaps display patterns of gene-gene correlations of the top 100 biomarkers of paclitaxel in three different cancer systems, NCI-60 cancer cell lines (top left), breast cancer (BR-251) (top middle), and ovarian cancer (OV-99) cohorts (top bottom). The bottom three panels show gene-gene correlation patterns of 54 concordantly co-expressed genes in the three-way COXEN analysis. Genes in breast and ovarian cancer heatmaps were sorted by the same order of genes in hierarchical cluster of NCI-60 correlation matrix.

