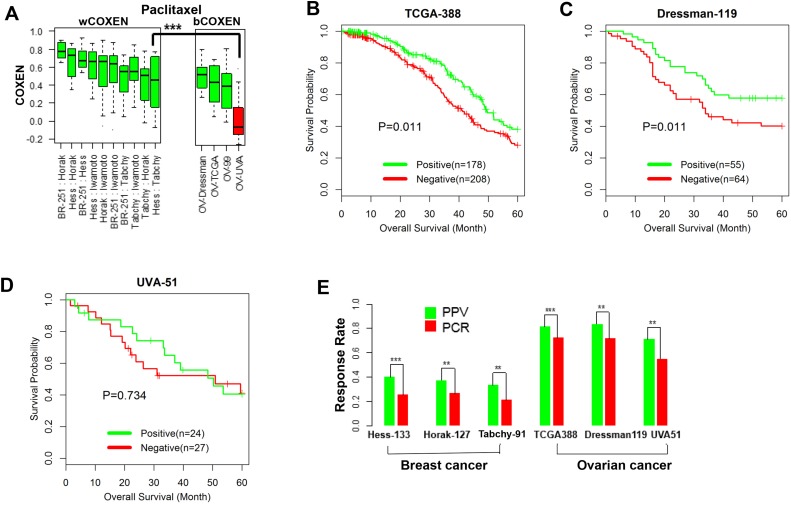
Figure 4. Cross-cancer type prediction of response to paclitaxel.
(A) wCOXEN and bCOXEN of final paclitaxel biomarkers in breast cancer and ovarian cancer cohorts: a red boxplot represents an ovarian cancer cohort, UVA-51, with significantly poor bCOXEN distribution, indicating unfitted for cross-cancer prediction. (B) Kaplan-Meier (KM) survival curves were calculated in predicted-positive (responsive) and predicted-negative (nonresponsive) groups of patients after outcome stratification in ovarian cancer cohorts and there are significant survival difference between the two groups in TCGA-388 (log rank-test p=0.011) and (C) Dressman-199 cohort (p=0.041) (D) but not in UVA-51 cohort (p=0.734) (E) positive predictive value of paclitaxel predictor (green) and pathological complete response rate (red) in breast cancer and ovarian cancer cohorts (** p<0.05, ***p < 0.01).

