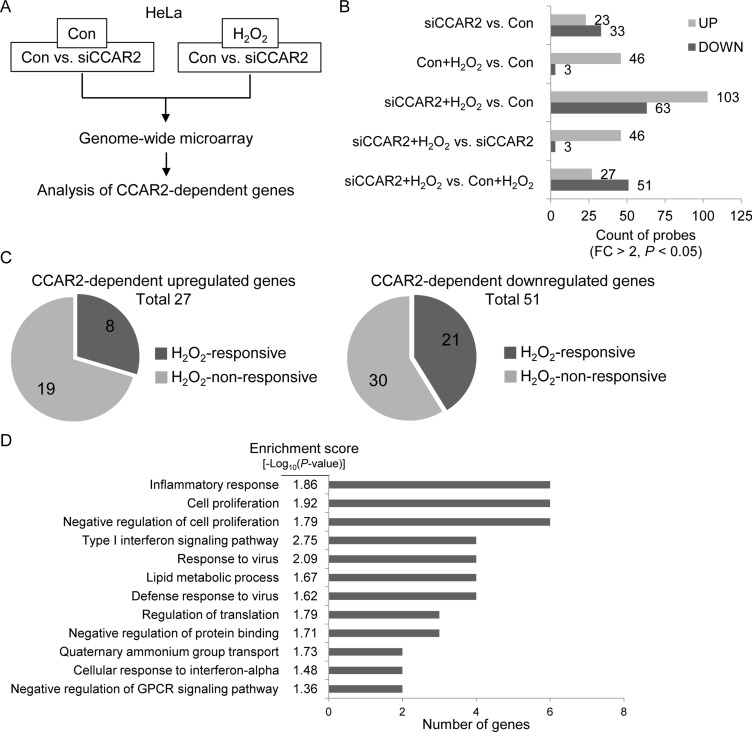
Figure 1. CCAR2 affects gene expression in response to oxidative stress.
HeLa cells were transfected with siCCAR2 (siC). Forty-eight hours later, cells were treated with 0.5 mM H2O2 for 2 h. (A) Microarray was performed and the results were analyzed. (B, C) Only genes showing a FC > 2 and a P value < 0.05 were counted. (B) Bar graph shows the number of up- and downregulated genes in the indicated groups. (C) Pie graph shows the number of H2O2-responsive genes dependent on CCAR2 for efficient up- (left) or downregulation (right). (D) GO term analysis was performed to identify biological processes. The annotation cluster is shown according to number of genes with a cluster enrichment score [-log10(P-value)].

