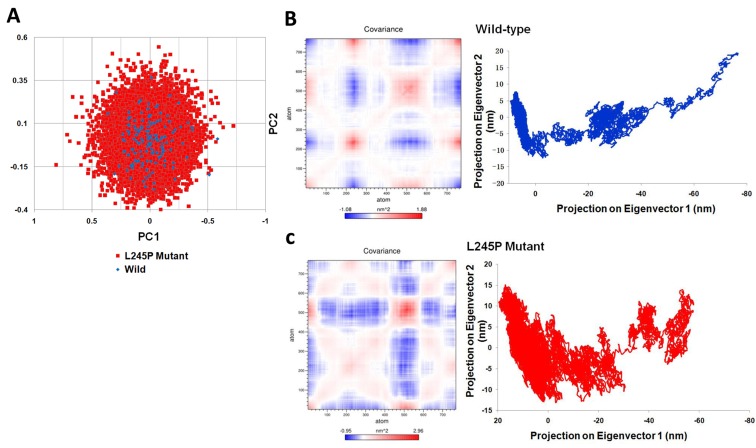
Figure 6. Dynamical effects of the p. L245P mutation on the PROM1 protein.
A.. PCA scatter plots along the pair of first two principal components, PC1 and PC2 for the wild-type and the L245P mutant showing differences between both types of eigenvectors. This represents optimal two-dimensional projections of the data over the 130 ns molecular dynamic trajectories. B. Cross correlation matrix C-alpha atomic graph and plot in during 130 ns simulation for the wild and C. the mutant systems. The range of motion is indicated by various colors in the panel. Red indicates positive correlation, whereas blue indicates anti-correlation. Totally, the L245P mutant effected a partial folding of the mutant protein region have the mostly anti-correlated motion; which is primarily involved in the interaction with other domains. These molecular changes were clearly depicted in the atomic density of distribution plot. There was a significant change in density distribution in native compared to the mutant. Moreover the mutant structure (L245P) shows highest atomic density distribution relative to the wild structure.

