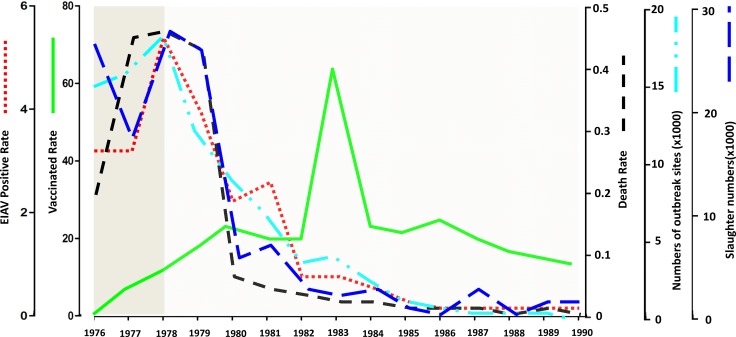
Figure 2. Statistics of EIAV control in China from 1976 to 1990.
The EIAV control in China from 1976 to 1990 is summarized. The red dotted line represents EIAV positive rate, the green line represents vaccinated rate; the black dotted line represents death rate; the wathet dotted line represents numbers of outbreak sites; the deep blue dotted line represent slaughter numbers.

