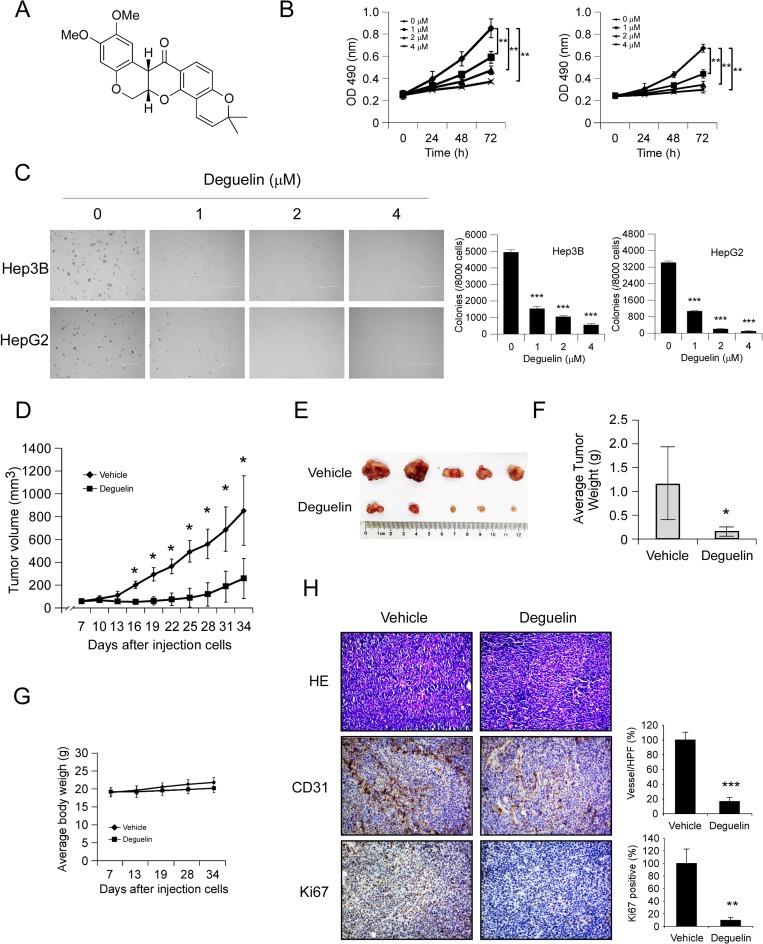
Figure 1. Deguelin inhibits hepatocellular carcinoma cells growth in vitro and in vivo.
(A) Chemical structure of deguelin. (B) Deguelin decreases cell growth. Hep3B (left) and HepG2 (right) cells were treated or not treated with deguelin as indicated, MTS assay was performed as described in Materials and Methods. The asterisk (**) indicates a significant (p < 0.01) decrease in cell proliferation by deguelin-treated cells. (C) Deguelin attenuates Hep3B and HepG2 anchorage-independent cell growth. Soft agar assay was performed as described in Materials and Methods. The asterisk (***) indicates a significant (p < 0.001) decrease in colony formation by deguelin-treated cells. (D–G) Deguelin inhibits tumor growth in vivo. (D) Tumor growth curve, (E) photograph of tumors in the vehicle and deguelin-treated group, (F) average tumor weight, (G) average body weight of mice. Data are represented as means ± SD of each group. The asterisk (*) indicates a significant difference (p < 0.05) compared with the deguelin-treated group. (H) Immunohistochemical examination of CD31 and Ki67 in tumor sections. Left panel, a representative photograph of tumor tissue per group (200×); right panel, the expression of indicated protein in per group was quantified, the asterisks (***p < 0.001) indicates a significant difference.

