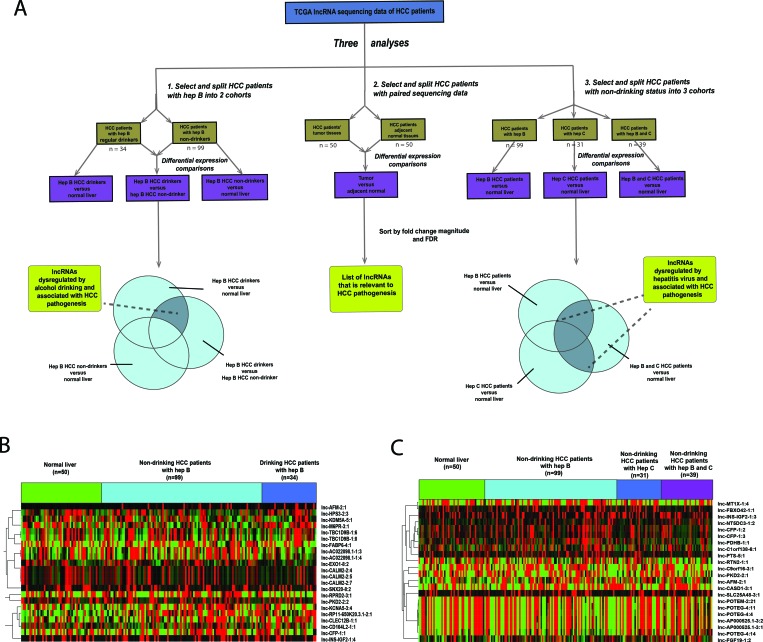
Figure 1. Identification of alcohol and hepatitis-dysregulated lncRNAs.
(A) Schematic illustrating the analysis approach used to identify alcohol and hepatitis-dysregulated lncRNA candidates (p < 0.05, FDR < 0.05). (B–C) Heatmap depicting normalized expression levels (in counts-per-million) of the 22 lncRNAs transcripts with the largest magnitude of dysregulation in (B) HBV+ HCV− drinker versus HBV+ HCV− nondrinker and (C) HBV+ HCV+ nondrinker versus normal liver.

