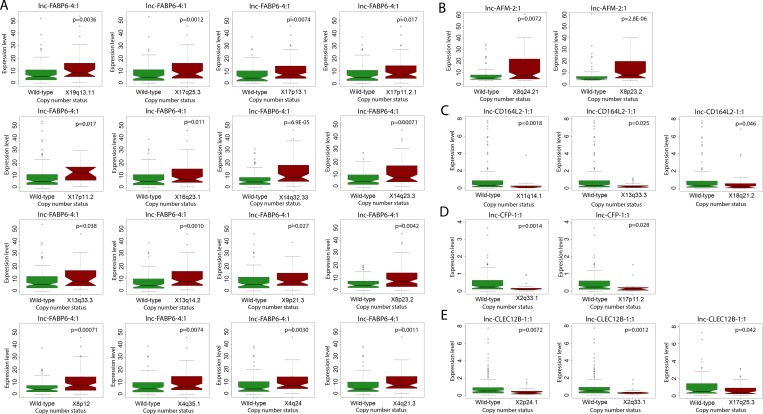
Figure 5. Correlation of lncRNA expression with copy number aberrations.
Boxplot showing significant correlation in copy number variation status and expression level (counts-per-million) of (A) lnc-FABP6-4:1, (B) lnc-AFM-2:1, (C) lnc-CD164L2-1:1, (D) lnc-CFP-1:1, and (E) lnc-CLEC12B-1:1 (Wilcoxon rank sum, p < 0.05).

