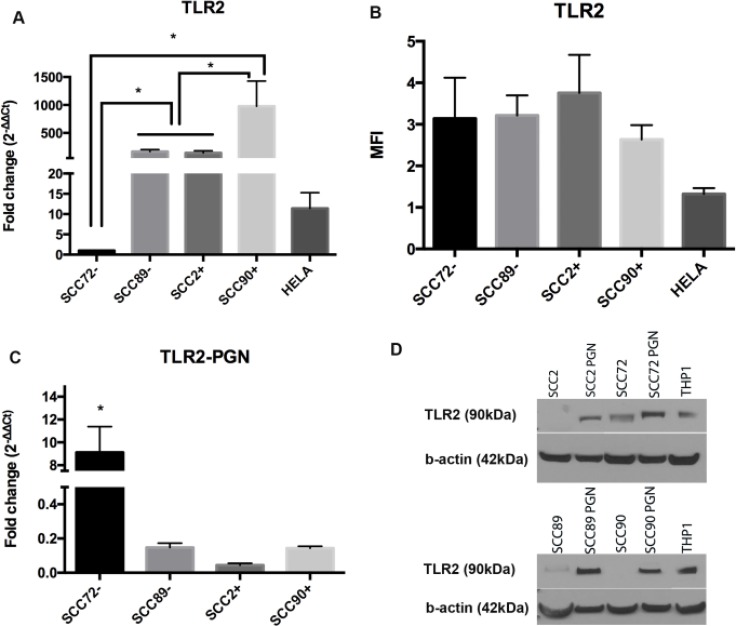
Figure 2. Expression of TLR2 in HPV– (SCC72 and SCC89), HPV16+ (SCC2 and SCC90) and HPV18+ (Hela).
(A) TLR2 gene expression relative to SCC72, by qPCR, shows significant difference between SCC72 and the other cell lines and between SCC89 and SCC2 compared to SCC90 (Median ± SEM, p < 0.01); (B) Median Fluorescence intensity (MFI), analyzed by flow cytometry: no significant difference between cell lines (Median ± SD), (C) TLR2 gene expression relative to SCC72 after PGN stimulus: SCC72 showed a significant difference between control and stimulated cells (Median ± SEM, p < 0.001); (D) Comparison of TLR2 expression between control (not stimulated) and cells stimulated with PGN: after stimulus all the cell lines expressed TLR2 (cropped gel). THP1 was used as control.

