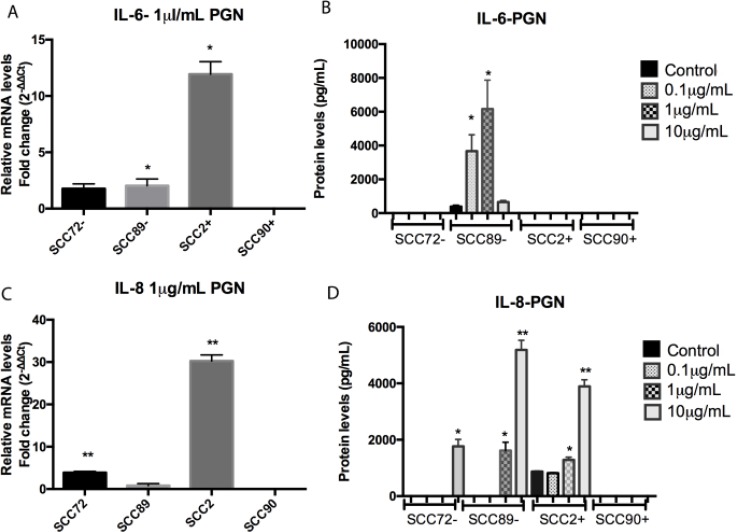
Figure 3. Comparison of IL-6 and IL-8 expression between non stimulated cells and cells stimulated with peptidoglycan (PGN).
(A) IL-6 mRNA expression, relative to SCC72, was significantly increased in SCC89 and SCC2 after stimulation with 1 µg/mL (*p < 0.05; mean ± SEM); (B) Protein expression of IL-6 was increased in SCC89 after stimulation with 0.1 and 1 µg/mL PGN (*p < 0.0001; mean ± SD); (C) IL-8 mRNA expression, relative to SCC72, was significantly increased in SCC89 and SCC2 after stimulation with 1 µg/mL of PGN (**p < 0.001; mean ± SEM); (D) Protein expression of IL-8 was increased in SCC72 after stimulation with 10 µg/mL, and SCC89 and SCC2 after stimulation with 1 and 10 µg/mL of PGN (*p < 0.01, **p < 0.0001; mean ± SD).

