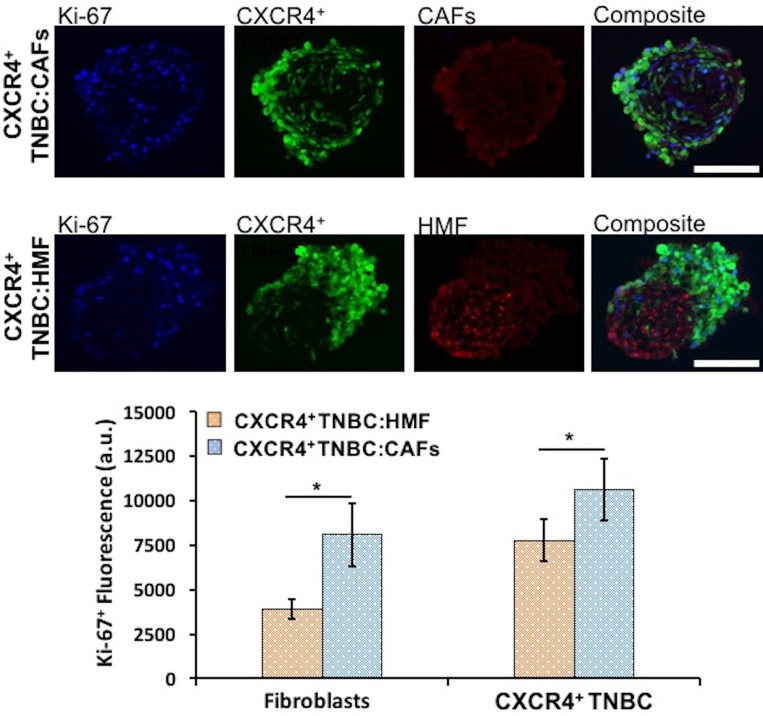
Figure 5.
Proliferation of CXCR4+TNBC cells and fibroblasts (HMF and CAFs) in co-culture spheroids characterized through measurements of Ki-67+ proliferative cells using immunostained images of cryosections of 4-day old spheroids. Both cancer cells and fibroblasts show significantly greater proliferation in the CXCR4+TNBC:CAFs co-culture model (blue bars). Scale bar is 200 µm. *p < 0.05.

