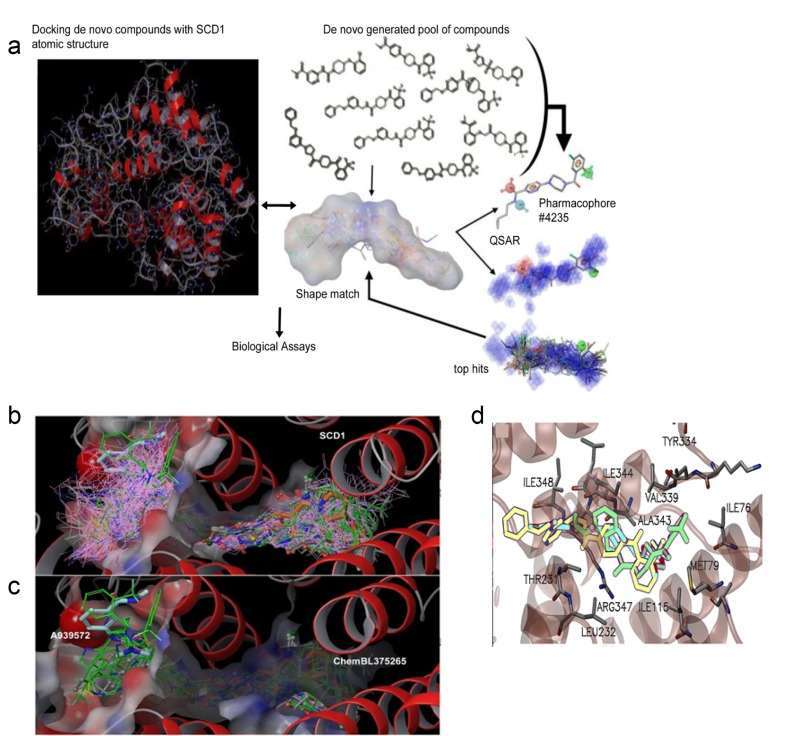
Figure 2. Discovery of SSI-1, SSI-2, SSI-3, and SSI-4 as novel inhibitors of SCD1.
(a) Schema of in silico modeling strategy, where compounds are identified through core, or scaffold-hopping generation, followed by QSAR pharmacophore shape matching after identification of reactive functional groups. Top hits are then validated through functional screening to identify novel lead compounds. (b) Docking of novel generated compounds with SCD1 protein is given. The binding pocket is shown with the electrostatic colored surface. Binding poses for all compounds that survived the shape filter to docking filtration. Docking poses for all good scoring compounds (docking score < -8.0) are rendered in pink wire frame. Two known inhibitors are shown in cyan (A939572) and orange (ChemBL375265) CPK rendering. Structures shown in green licorice rendering represent the top 282 compounds from docking. (c) Docking of 38 synthesized compounds (green sticks) is shown with two known compounds (A939572 and ChemBL375265). The surface of the binding pocket reveals a very deep tunnel for substrate binding with electrostatic charge distribution shown on the surface. SCD1 helical regions are rendered as red ribbons. (d) Ligand interaction map for three top de novo inhibitors is given. Rendered as licorice models, SSI-1, SSI-3, and SSI-4 are shown in yellow, green, and blue. Adjacent residues within 5Å of the inhibitors are rendered in standard color (carbon-gray, oxygen-red, nitrogen-blue) with the alpha-helical region rendered in transparent red ribbons for clarity of view.

