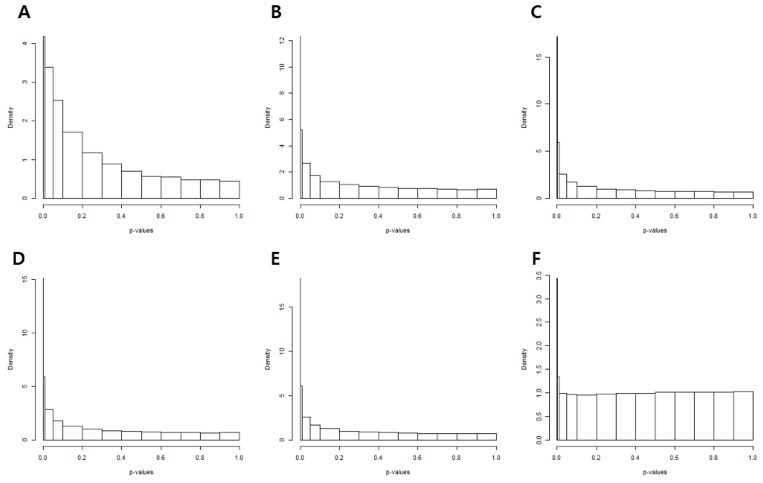
Figure 4. P-value histograms of each removing unwanted variation methodology.
(A) The histogram obtained from t-tests show exponential distribution. The variance of the statistic was calculated by (B) the standard method, (C) empirical bayes, (D) rescaled variance, and (E) rescaled variance with empirical Bayes. (F) Distribution and peak of p-values when variance of the statistic was calculated by the empirical variance

