
Figure 5. mRNA expressions of sodium transporters in obstructed kidneys following MnTBAP treatment.
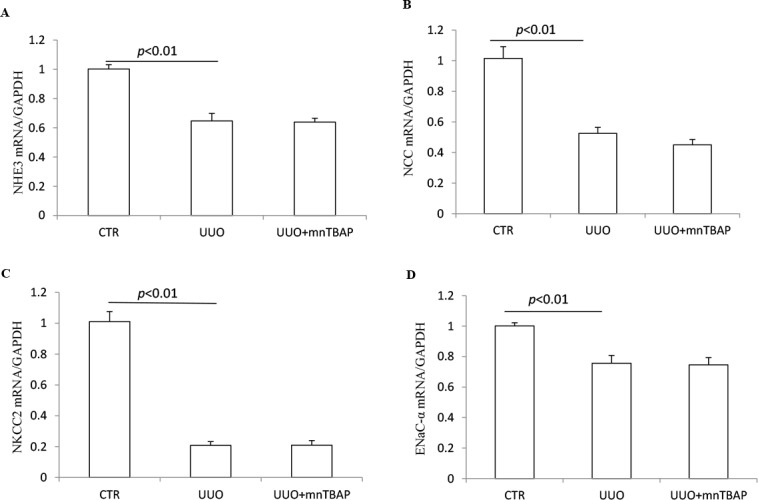
(A) qRT-PCR analysis of NHE3. (B) qRT-PCR analysis of NCC. (C) qRT-PCR analysis of NKCC2. (D) qRT-PCR analysis of ENaCα. The presented data are means ± SE. N = 6 in each group.