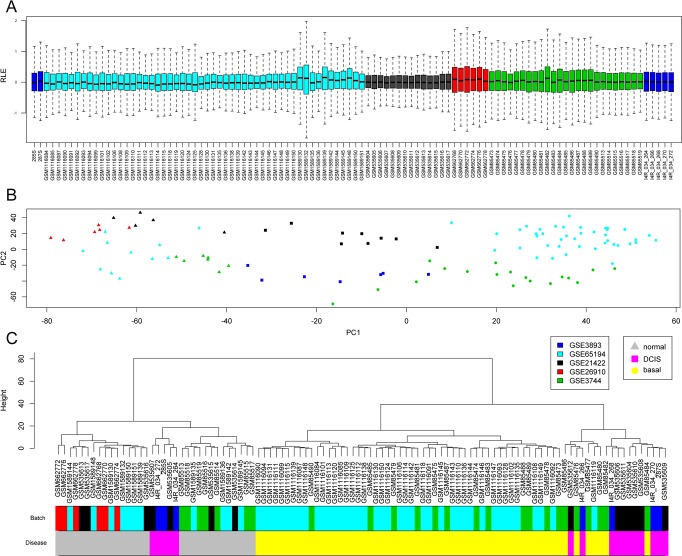
Figure 1. Global analysis of transcriptomes among samples.
In the whole panel, colors indicate the different public GEO datasets used and shape indicates clinical diagnostic. (A) Boxplot for all probes normalized relative log expression (RLE) values indicating no major difference between datasets. (B) PCA for top variable genes showing the first 2 principal components for all samples in the combined dataset, showing PC1 majorly representing differences in diagnostic. (C) Clustering analysis of previous PC1 values confirming that clusters mainly reflect diagnostic over differences batches.

