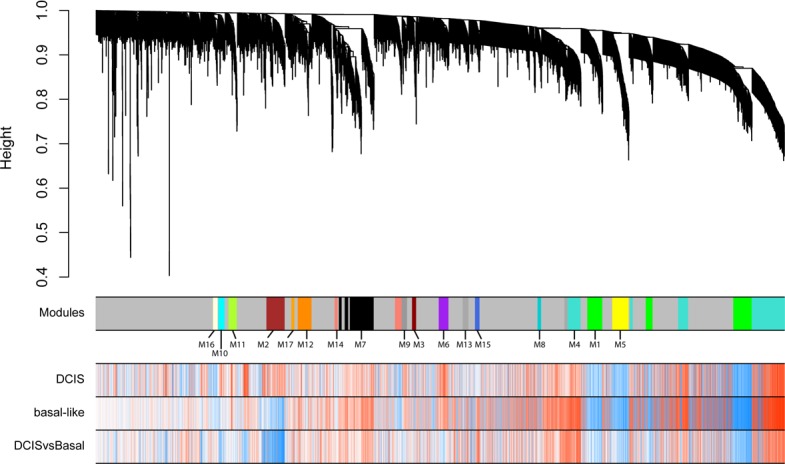
Figure 2. Weighted gene co-expression network analysis of the entire dataset transcriptome using top variable genes identifies 17 modules.

Unassigned genes were labelled in grey. Dendrogram obtained by hierarchical clustering of genes based on their topological overlap is shown at the top. Rows indicate gene correlation values with normal vs DCIS, normal vs basal and DCIS vs basal (blue indicating negative, and red positive, correlations).
