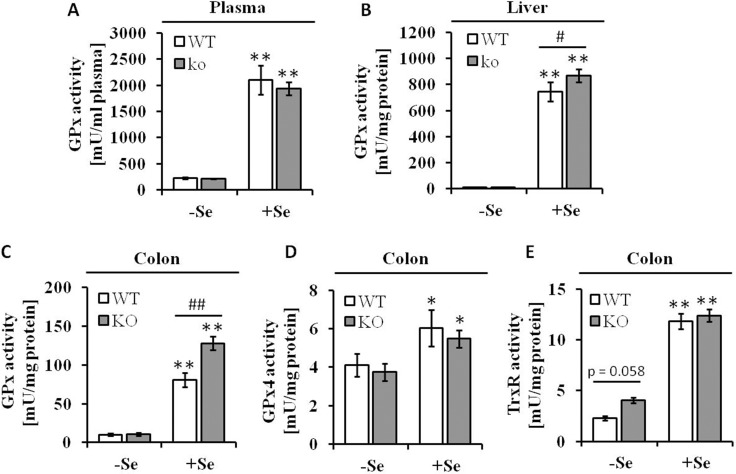
Figure 1. Se status following eight weeks of feeding with different Se concentrations.
Enzyme activities of (A) GPx in plasma, (B) GPx in liver and (C) in colon lysates, (D) GPx4 and (E) TrxR in colon tissues were spectrophotometrically determined as described in the Material and Methods section. Values are given as means ± S.E.M. (n = 9). Significant differences were calculated by one-way ANOVA. *p < 0.05; **p < 0.01 vs. the respective -Se group; ##p < 0.01 WT vs. KO within the same Se supply level.

