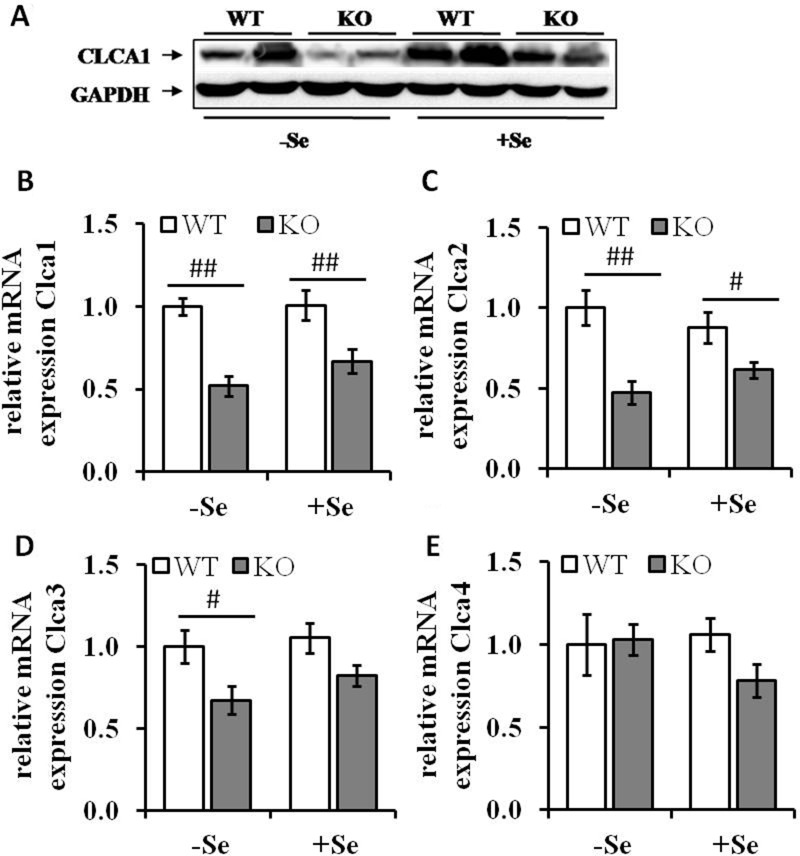
Figure 3. Expression levels of Clca isoforms are decreased by GPx2 knockout.
(A) Protein levels of CLCA1 were analyzed by Western blotting; mRNA expression levels of (B) Clca1, (C) Clca2, (D) Clca3 and (E) Clca4 were analyzed by qRT-PCR, normalized to the amplification data of GAPDH, ß-actin and RPL13a and expressed in relation to the –SeWT group. Values are given as means ± S.E.M (n = 9 per group). #p < 0.05, ##p < 0.01 (one-way ANOVA).

