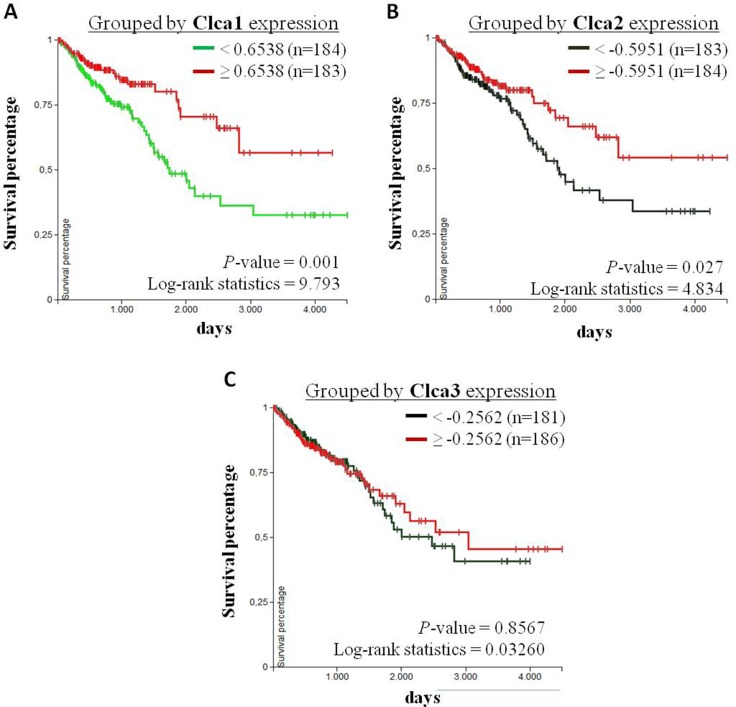
Figure 4. Correlation analysis of Clca isoform expression levels with overall survival of CRC patients.
Kaplan-Meier curves of CRC patients with primary tumors (TCGA-COADREAD, n = 380) were analyzed using the UCSC Xena browser (https://xenabrowser.net). Patients were grouped by the 50 percentiles of (A) Clca1, (B) Clca2 and (C) Clca3 expression levels. The differences between the curves were analyzed with the log-rank test and considered to be statistically significant when p < 0.05.

