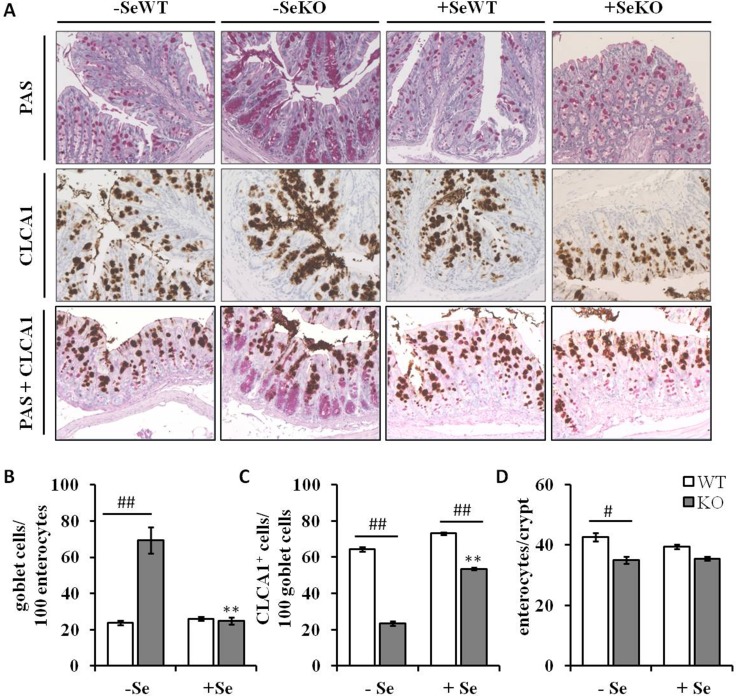
Figure 5. Histological and immunohistochemical analyses of colon sections.
(A) Representative microscopy pictures of colon sections stained with PAS for counting goblet cells (upper row), an anti-CLCA1 antibody for visualizing CLCA1 positive cells (middle row), and co-staining of goblet cells and CLCA1 positive cells (bottom row) (B) number of goblet cells per 100 enterocytes, (C) number of CLCA1 positive cells per 100 goblet cells and (D) number of enterocytes per colon crypt are expressed as means ± S.E.M (n = 4 per group). *p < 0.05, **p < 0.01 vs. the respective -Se group; #p < 0.05, ##p < 0.01 WT vs. KO within the same Se supply (one-way ANOVA). HPF, high power field, CLCA1, Calcium-activated chloride channel regulator 1; PAS, periodic acid-Schiff.

