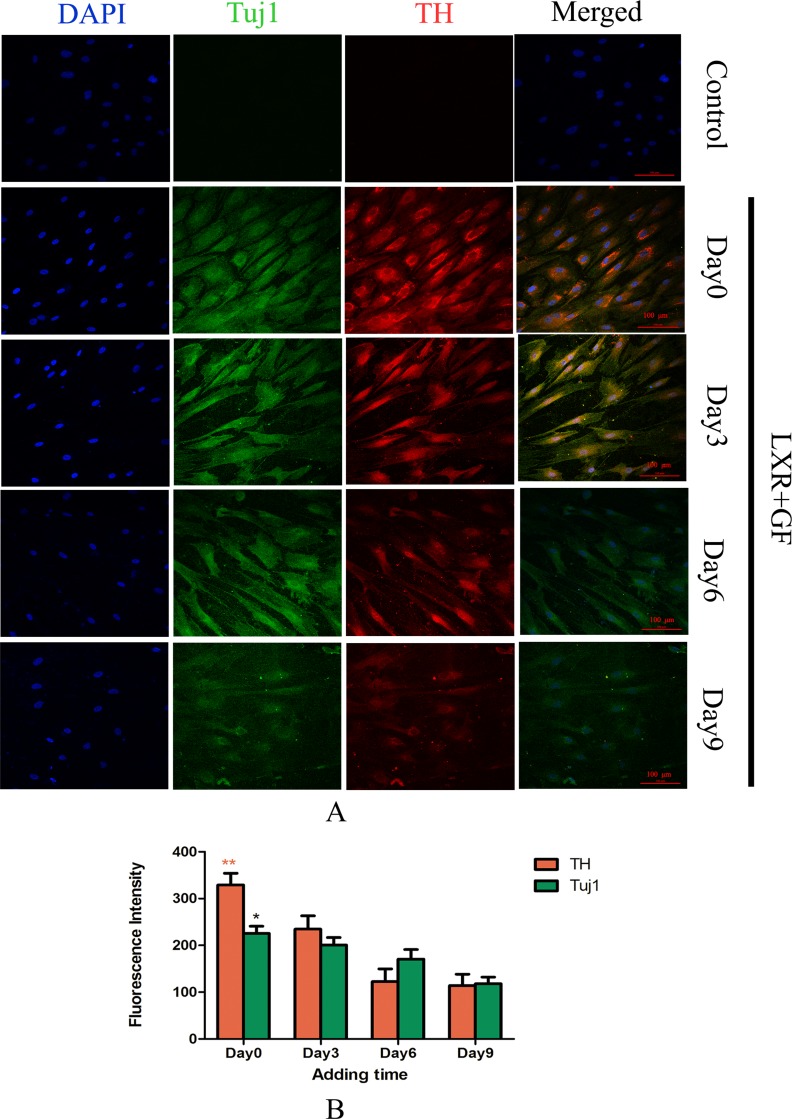
Figure 2. Determine the adding time of LXR agonist (× 200, Scale bars = 100 μm).
(A) Change in expressions of Tuj1 and TH. No expression of Tuj1 and TH was detected in control group. Cells in LXR+GF group displayed merged images of double staining with Tuj1 (dylight 488, green) and TH (dylight 549, red). Colocalization was identified by the yellow fluorescence in the merged images. Expressions of Tuj1 and TH reached the peak at simultaneous addition of LXR agonist and GF (day 0). Accompanying with the adding time of LXR agonist delayed, expressions of Tuj1 and TH were decreased gradually. Thus, the optimal adding time of LXR agonist was at day 0. (B) Group data showing change in expressions of Tuj1 and TH. Data are expressed as mean ± SD (n = 5). *P < 0.05 and **P < 0.01, compared with day3, respectively.

