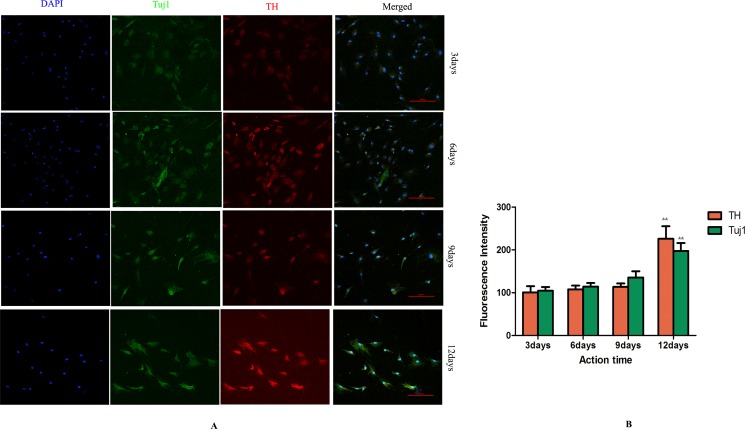
Figure 4. Determine the time for induction period of GF (× 200, Scale bars = 100 μm).
(A) Change in expressions of Tuj1 and TH. Cells in GF group displayed merged images of double staining with Tuj1 (dylight 488, green) and TH (dylight 549, red). Colocalization was identified by the yellow fluorescence in the merged images. Expressions of Tuj1 and TH were gradually increased in GF group and maximal expressions were obtained at 12 days. (B) Group data showing change in expressions of Tuj1 and TH. Data are expressed as mean ± SD (n = 5). &&P < 0.01, compared with 9 days for induction.

