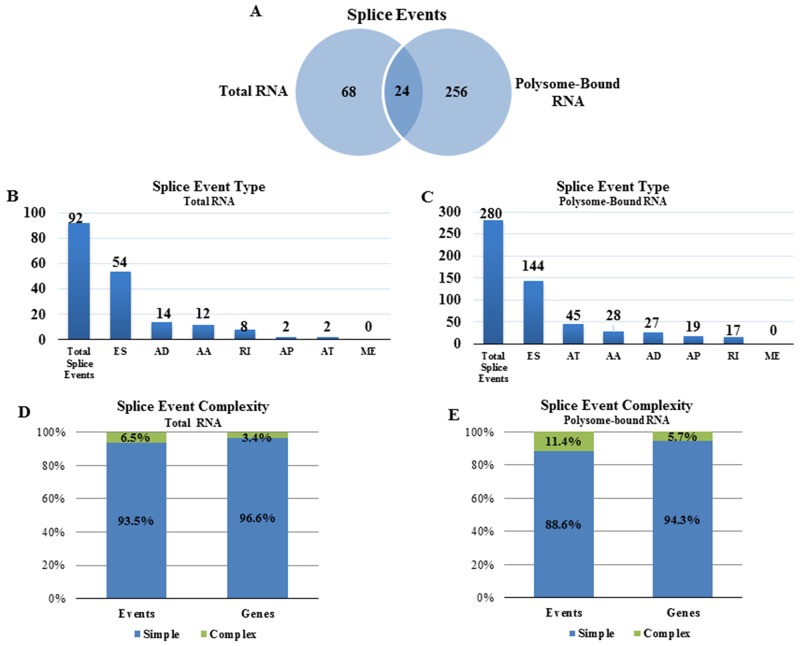
Figure 2. Radiation-induced alternative splice events in the transcriptome and the translatome.
(A) Venn diagram comparing the number of radiation-induced alternative splice events in total versus polysome-bound RNA. Number of radiation-induced splice events in (B) total RNA and (C) polysome-bound RNA according to category as defined in Figure 1. Complexity of radiation-induced splice events in the (D) transcriptome and (E) translatome. Simple (blue) refers to 1 event and complex (green) refers to more than 1 event.

