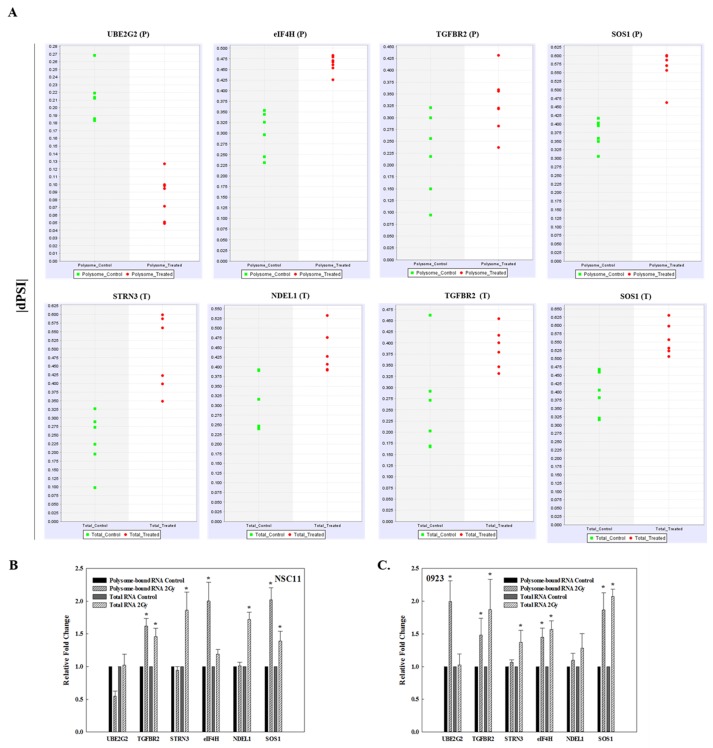
Figure 3. Validation of radiation-induced alternative transcripts in total and polysome-associated RNA.
(A) dPSI (change in percent spliced in) scatter plots for the individual replicates of mock irradiated (control, green) and irradiated (2 Gy, 1h, red) in polysome-associated RNA (P) and total RNA (T). qRT-PCR of polysome-bound RNA and total RNA of the indicated gene normalized to 18S rRNA in (B) NSC11 cells and (C) 0923 cells. Each value represents the mean ± SEM for 3 independent experiments. *p < 0.05 according to Student’s t-test (radiation vs. control).

