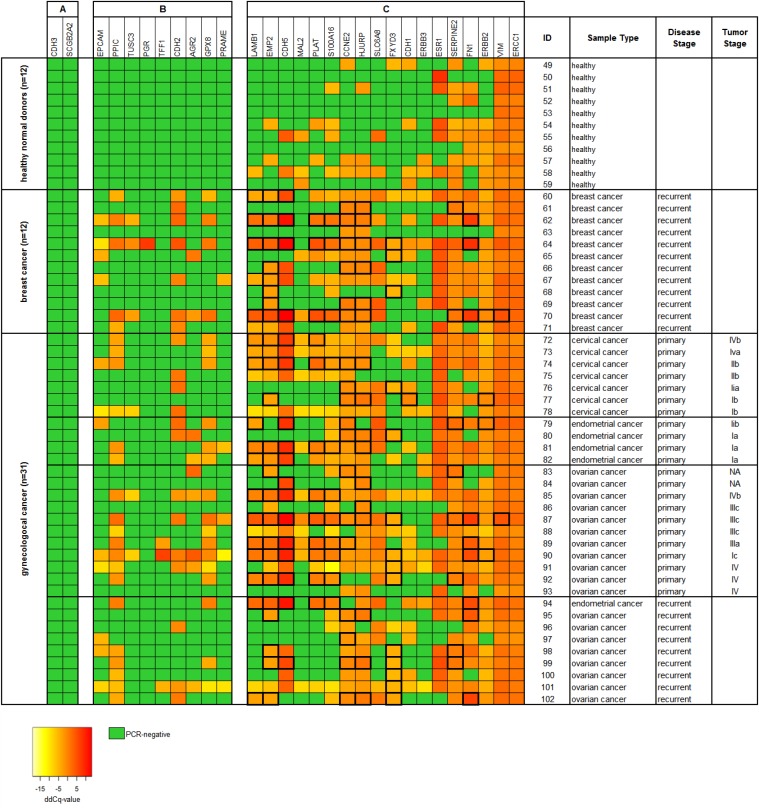
Figure 5. Heat map of relative gene expression levels of 29 CTC-related gene markers of Parsortix™ enriched blood samples (cohort 2).
Each 20 ml blood from 11 healthy donors and 43 cancer patients were processed using protocol A (comprising an upfront density gradient enrichment). RT-qPCR was performed following a pre-amplification step of the respective transcripts. Raw Cq values were normalized to the reference gene B2M, resulting in dCq values. ddCq values were obtained by normalizing dCq values to a calibrator sample. The gene markers are ranked according to their respective gene expression levels in the samples from (A) undetected in both healthy donors and cancer patients, (B) undetected in healthy donors but not in cancer patients, and (C) detected in both healthy donors and cancer patients. ddCq levels above the two-fold standard deviation from the mean gene expression in the healthy donor samples are framed with thick black lines. Tumor stages of the primary gynecological cancers are given according to the FIGO classification system.

