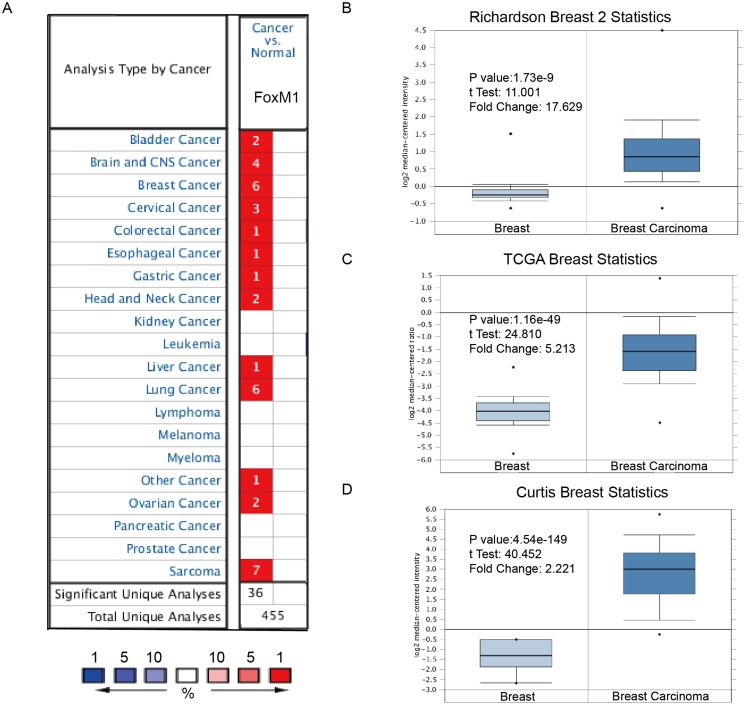
Figure 1. FoxM1 was significantly overexpressed in breast cancer comparing with normal breast tissue.
(A) FoxM1 mRNA expressions (cancer vs. normal tissue) analyzed with ONCOMINE database. The graphic demonstrated the numbers of datasets with statistically significant mRNA over-expression (red) or down-expression (blue) of the target gene. The p value threshold is 0.01. The number in each cell represents the number of analyses that meet the threshold within those analysis and cancer types. The gene rank was analyzed by percentile of target gene in the top of all genes measured in each research. Cell color is determined by the best gene rank percentile for the analyses within the cell. (B–D) Comparison of FoxM1 mRNA expression in Richardson’s study (B), TCGA breast statistics (C), and Curtis’s study (D). Box plots derived from gene expression data in ONCOMINE comparing expression of a specific GATA family member in normal and BC tissue. The p value was set up at 0.01 and fold change was defined as 2.

